
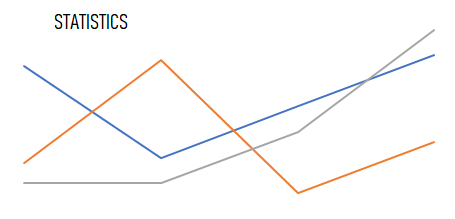
The characteristics of a data set are called “Descriptive Statistics.” And the estimation of population’s characteristics using descriptive statistics are called “Inferential Statistics”.
Continue reading “[Statistics 101] (5) Descriptive and Inferential”[Statistics 101] (4) Data – Examples
In this post, I will show some examples of how to summarize and display data.
Continue reading “[Statistics 101] (4) Data – Examples”[J. R. R. Tolkien] The Lord of the Rings – The Two Towers

The Lord of the Rings
- Title: Part Two – The Two Towers
- Author: J. R. R. Tolkien
- Published: 1954
- Publisher: HarperCollins Publishers
- ISBN: 0-00-712971-8
[J. R. R. Tolkien] The Lord of the Rings – The Fellowship of the Ring

The Lord of the Rings
- Title: Part One – The Fellowship of the Ring
- Author: J. R. R. Tolkien
- Published: 1954
- Publisher: HarperCollins Publishers
- ISBN: 0-00-712970-X
[Isaac Asimov] Prelude to Foundation
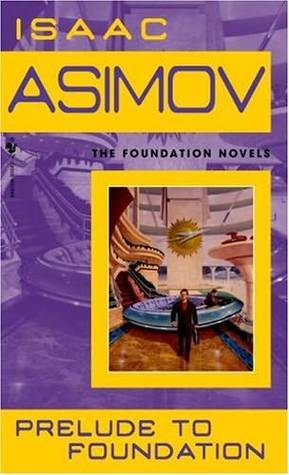
Foundation Series
- Title: Prelude to Foundation
- Author: Isaac Asimov
- Published: 1968
- Publisher: Bantam Dell
- ISBN: 978-0-553-27839-2
[Chemistry] Matter

Matter is anything that has mass and occupies space – Solid, Liquid, and Gas. Mass is the measure of the amount of matter present.
Continue reading “[Chemistry] Matter”[Science] Scientific Method

Science is a systematic and organized method of studying nature based on observing facts and verifying results.
Continue reading “[Science] Scientific Method”[Agatha Christie] Crooked House

- Title: Crooked House
- Author: Agatha Christie
- Published: 1949 (19th impression 1978)
- Publisher: Fontana / Collins
- ISBN: 000-613798-9

